The Tasksets page at hud.ai/evalsets lets you organize tasks into collections for running evaluations. Group related tasks together, track leaderboard results, and compare agent performance.Documentation Index
Fetch the complete documentation index at: https://docs.hud.ai/llms.txt
Use this file to discover all available pages before exploring further.
Overview
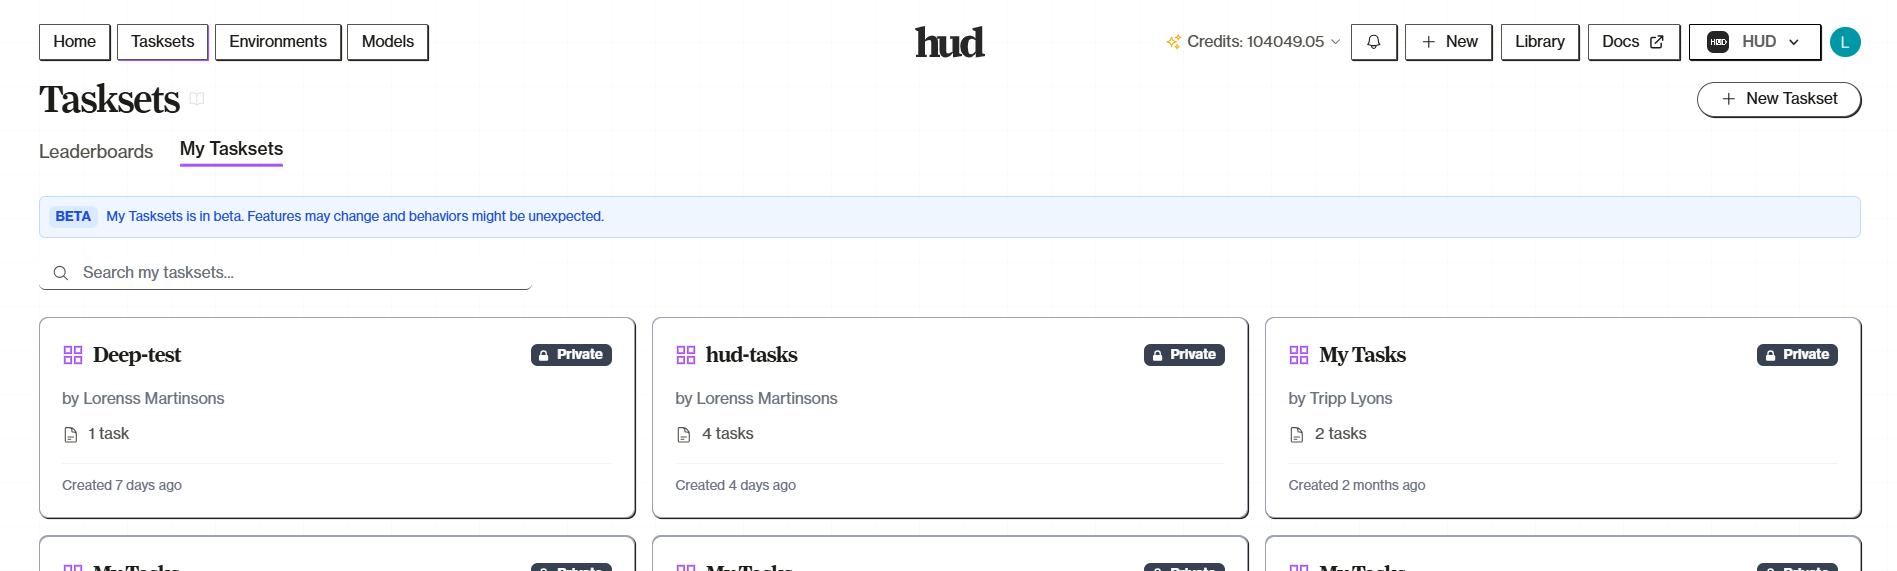
Navigate to Tasksets to see two tabs:- Leaderboards — Public benchmarks with ranked results
- My Tasksets — Your personal task collections
Leaderboards
The Leaderboards tab shows public benchmarks from the community:- Dataset cards — Each card shows a benchmark with ranked entries
- Metrics — Average score, Best@3, Best@5
- Filter by organization — Focus on specific providers
- Search — Find specific benchmarks
Creating a Taskset
Click New Taskset to create one:- Enter a name for your taskset
- Click Create
- You’re taken to your new (empty) taskset
Adding Tasks
Once you have a taskset, add tasks in two ways: From an Environment’s Scenarios:- Go to an environment’s Scenarios tab
- Click on a scenario
- Create tasks with specific arguments
- Select your taskset as the destination
- Open your taskset
- Click Upload Tasks in the header
- Paste a JSON array of task configurations
- The modal validates your tasks before upload
Taskset Details
Click on a taskset to see its detail page:Leaderboard Tab
Shows aggregated results for this taskset:- Agent rankings — Performance by agent/model
- Metrics — Success rate, average score
- Trends — Performance over time
Tasks Tab
Lists all tasks in the taskset in a data grid. Each row shows:- Task name — Click to open the task detail panel
- Progress — Clickable progress pips for review stages
- Tr (Traces) — Trace count; click to open the detail panel directly to the Traces tab
- Reward — Average reward score
- Distribution — Mini histogram of reward values
- Updated — Relative timestamp
- Custom columns — Data columns and QA agent result columns
Task Detail Panel
Click any task row to open a slide-out panel on the right. The panel has four tabs: Task, Traces, Comments, and History. Each tab is accessible via URL (?panel_tab=task, etc.) so you can link directly to a specific view.
Task Tab
The top of the panel shows:- Task name with a play-on-hover icon to run the task
- Progress pips — interactive, labeled stages (e.g. “ready”, “verified”) that you can toggle by clicking
- Scores — reward value with a histogram and x-axis to the right
- Environment badge — links to the environment page
- Scenario arguments — editable inline. Simple strings shorter than 30 characters render as single-line inputs; longer strings use a textarea. JSON objects and arrays use a JSON editor. Changes save immediately and create a new task version.
- Custom columns — editable task-level data columns appear under a COLUMNS heading (hidden if none exist)
Traces Tab
Shows all traces for this task, capped at the configured pass@K value. The tab badge displaysx/K where x is the number of traces with a reward entry.
QA Agent toolbar at the top of the tab:
- Each attached QA agent appears as a compact pill with a play button
- Click the play button for options: Run for this task or Run for all tasks (N)
- Add QA Agent button to attach new agents
- Version label (
v1,v2, etc.) — older versions show an amber warning badge - Model name — the agent/model used
- Reward — evaluation score
- Wallclock time, steps, and tokens — compact metrics next to the trace name
- QA analysis results — collapsible rows below each trace showing verdicts from attached agents; agents without results show a Run button
Comments Tab
A unified activity feed that combines:- Comments — post messages with Enter to send, Shift+Enter for new lines
- Task update history — when scenario arguments change or versions are created
- Progress status changes — every progress update (completion/un-completion) is recorded
History Tab
Shows a version-by-version diff of task changes:- Summary — which arguments changed between versions, who made the change
- Word-level diffs — GitHub-style collapsible diff view showing exactly what was added, removed, or modified in each argument
- Optimized for large inputs with performance guards and fallback rendering for very long values
Running a Taskset
Run all tasks in a taskset with one click:- Open your taskset
- Click Run Taskset in the header
- Select model and configuration
- Jobs are queued and run in parallel
Task Configuration
Tasks are defined with:- scenario — The scenario name to run
- args — Arguments passed to the scenario
- env.name — The environment containing the scenario
- prompt — (Optional) Override the scenario’s default prompt
Next Steps
QA Agents
Attach automated analysis to your traces
Publishing Leaderboards
Run evaluations and publish public benchmarks
Environments
Create environments with scenarios
Automations
Run scenarios repeatably with pre-filled arguments